Using the Insights Dashboard Page
- Go to the project menu and click Ecological Insights.

-
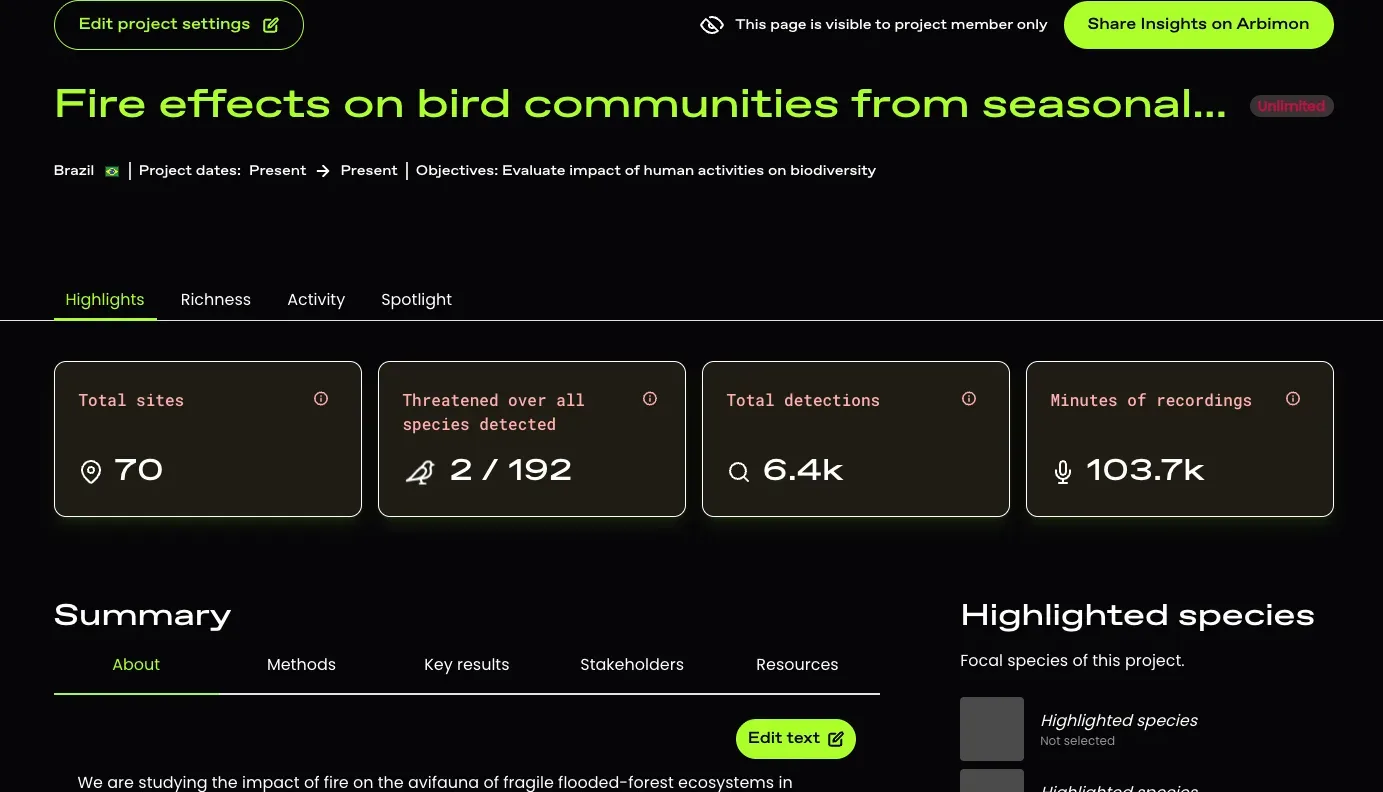
The Dashboard page will open by default. This page shows summary states, including:
-
Number of sampling sites (with recordings and coordinates)
- note that hidden sites and sites without recordings are not included in this count but ARE included in the Project Overview page
- Number of species detected and how many are threatened (IUCN Red List) in the project
- Total number of detections (across all species) in the project
- Total number of minutes of recordings in the project

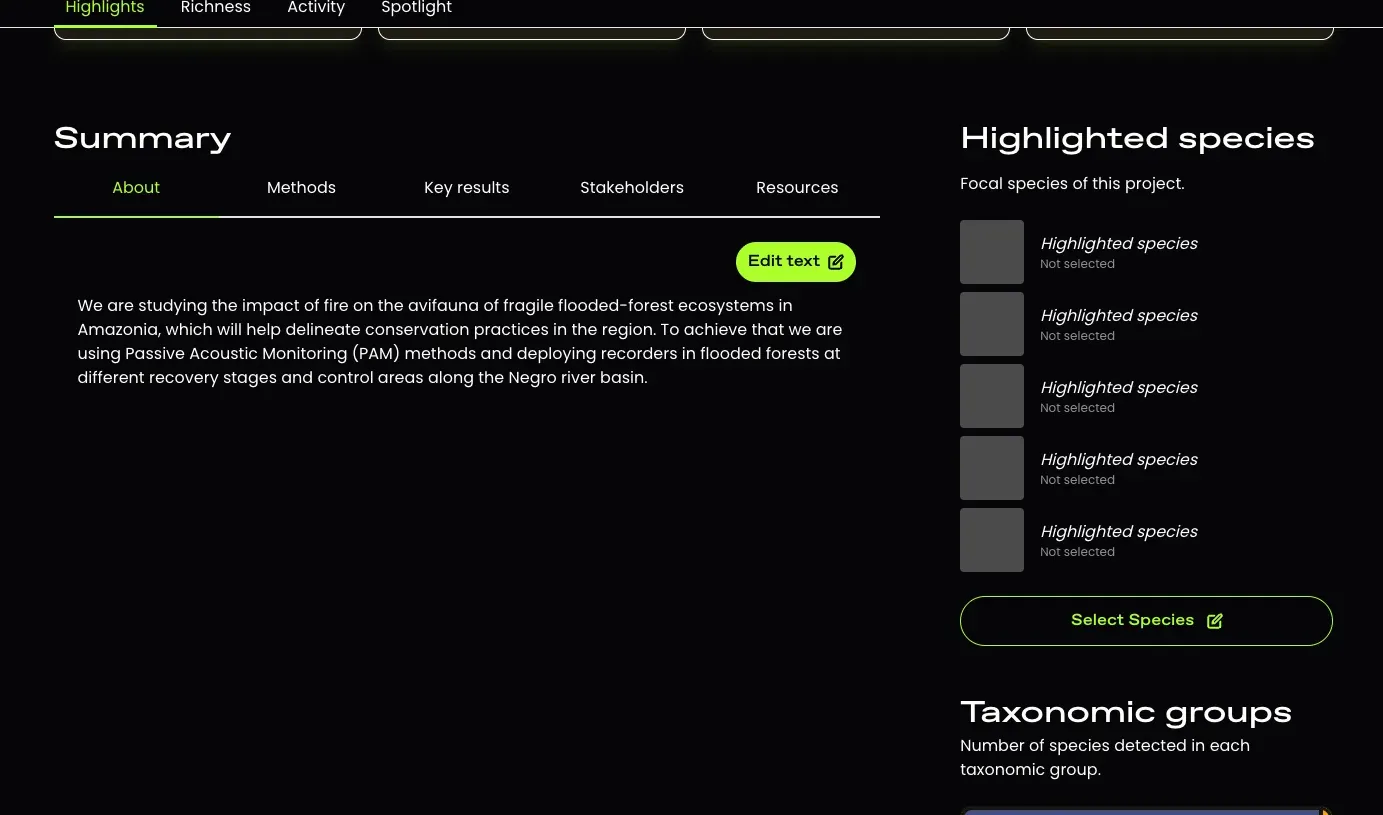
- Overview of the project, including objectives, methods, results, stakeholders (where you can find contact info for the project owner), resources

- Information on the highlighted species and taxonomic groups detected in the project

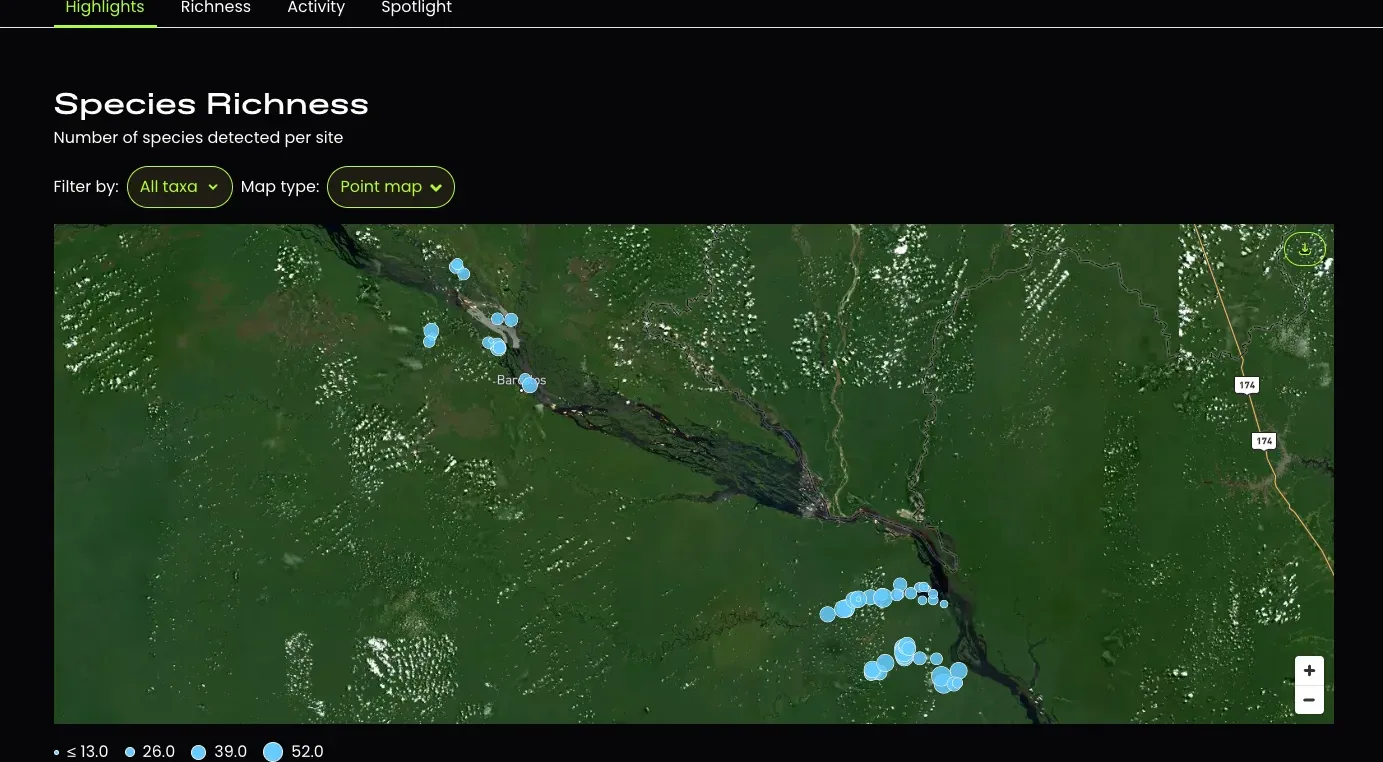
- Heatmap showing the number of species detected at each site